
How to use LinkedIn Analytics 📊
And debug your profile 👀

Imagine deploying a critical application to production and then completely turning off the logs and the monitoring dashboards. You just push the code and hope for the best.
As a developer, you would never do that. You need observability to know if the system is healthy.
Yet, this is exactly how most developers treat their LinkedIn profile. They write a bio, add some skills, “deploy” it, and then ignore the data.
But if you look at your profile right now, there is a section called “Analytics”. It gives you a dashboard full of logs. It’s not just three numbers; it’s a complete breakdown of your audience, your reach, and your engagement quality.
This article is a guide on how to read all those logs to debug your career—and the specific hacks to fix them.

1. The main dashboard: your system health check 🏥

Before diving deep, look at the three big numbers at the top.
Profile views: This is Traffic to your Landing Page. If it’s low, your headline or picture isn’t convincing people to click.
Post impressions: This is your Throughput. Are you broadcasting effectively?
Search appearances: This is your SEO. Are you indexing for the keywords recruiters use?
If these are healthy, you need to dig deeper to see quality.
2. Profile views: the conversion rate check 👀
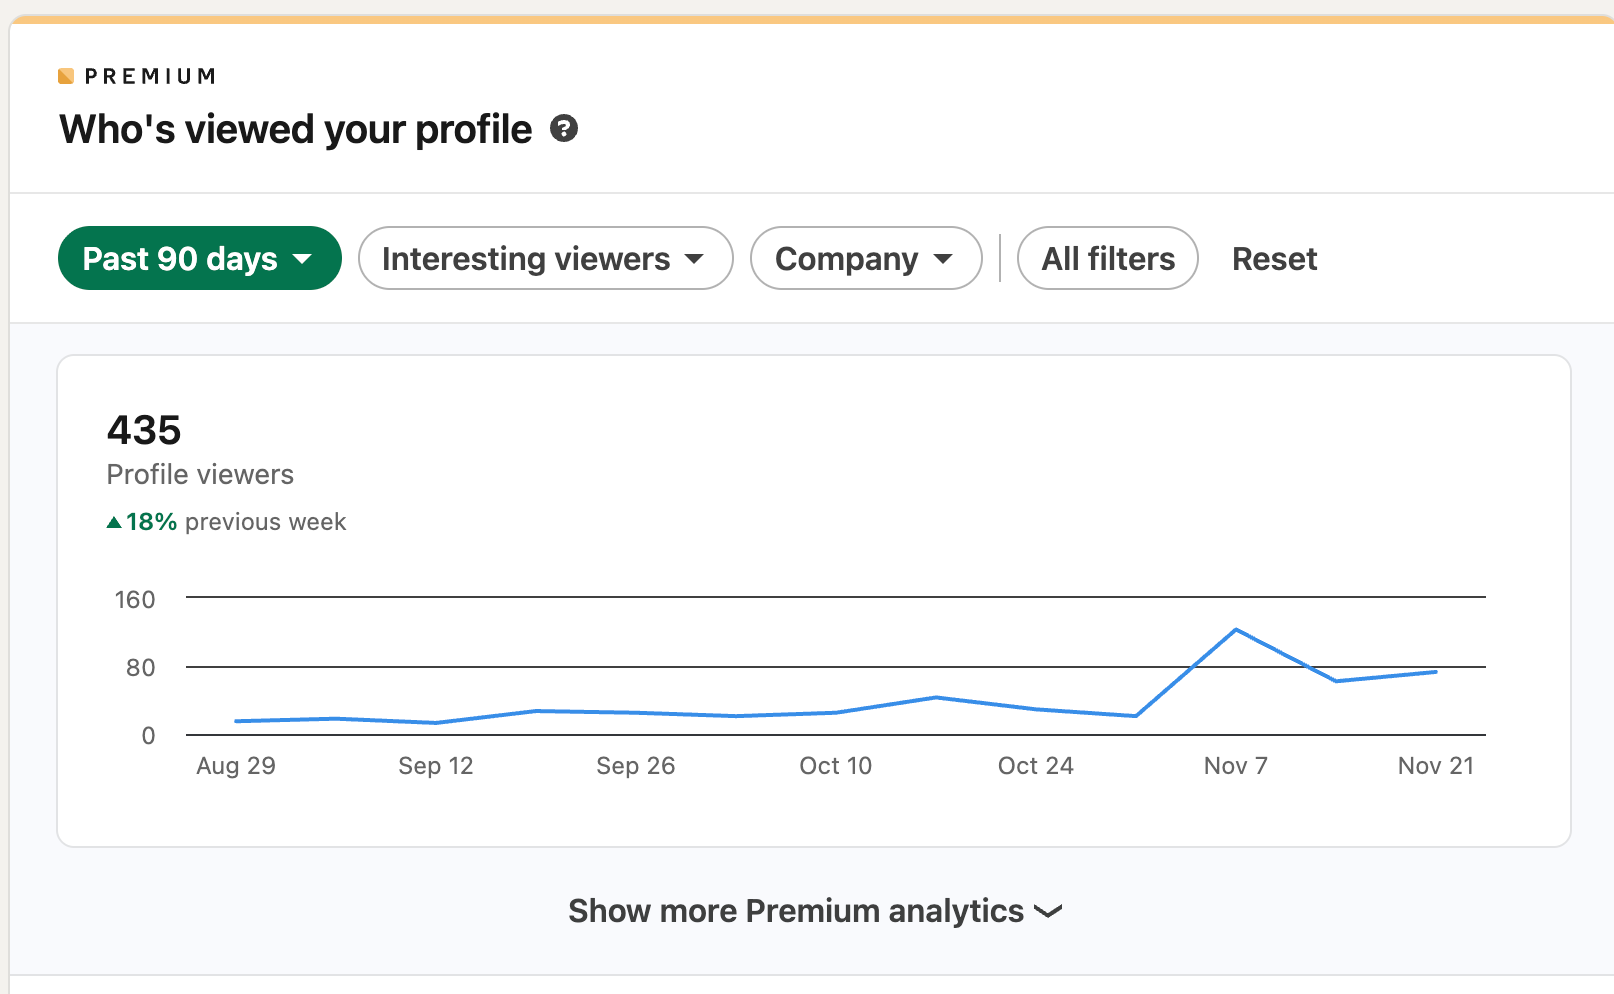
This metric tracks how many people actually clicked on your name after seeing you in a search or a feed.
Think of this as your Click-Through Rate (CTR).
There is a relationship between your activity and your views.
High Impressions / Low Profile Views: This is a “conversion” bug. People see your content, they read it, but they don’t care about you. Your content might be too generic or your headline (visible in the post) isn’t selling you well.
💡 How to debug: Your “snippet” is broken. When a recruiter or peer sees you in a list, they see three things: Picture, Headline, Location. If they don’t click, one of these is weak. Usually, it’s the Headline. It’s either too generic (”Software Engineer”) or too confusing. Fix: A/B test a clearer, more specific headline to get that click.
3. Content performance: reach vs. reality 📉
Click on “Post impressions” to see the real data.
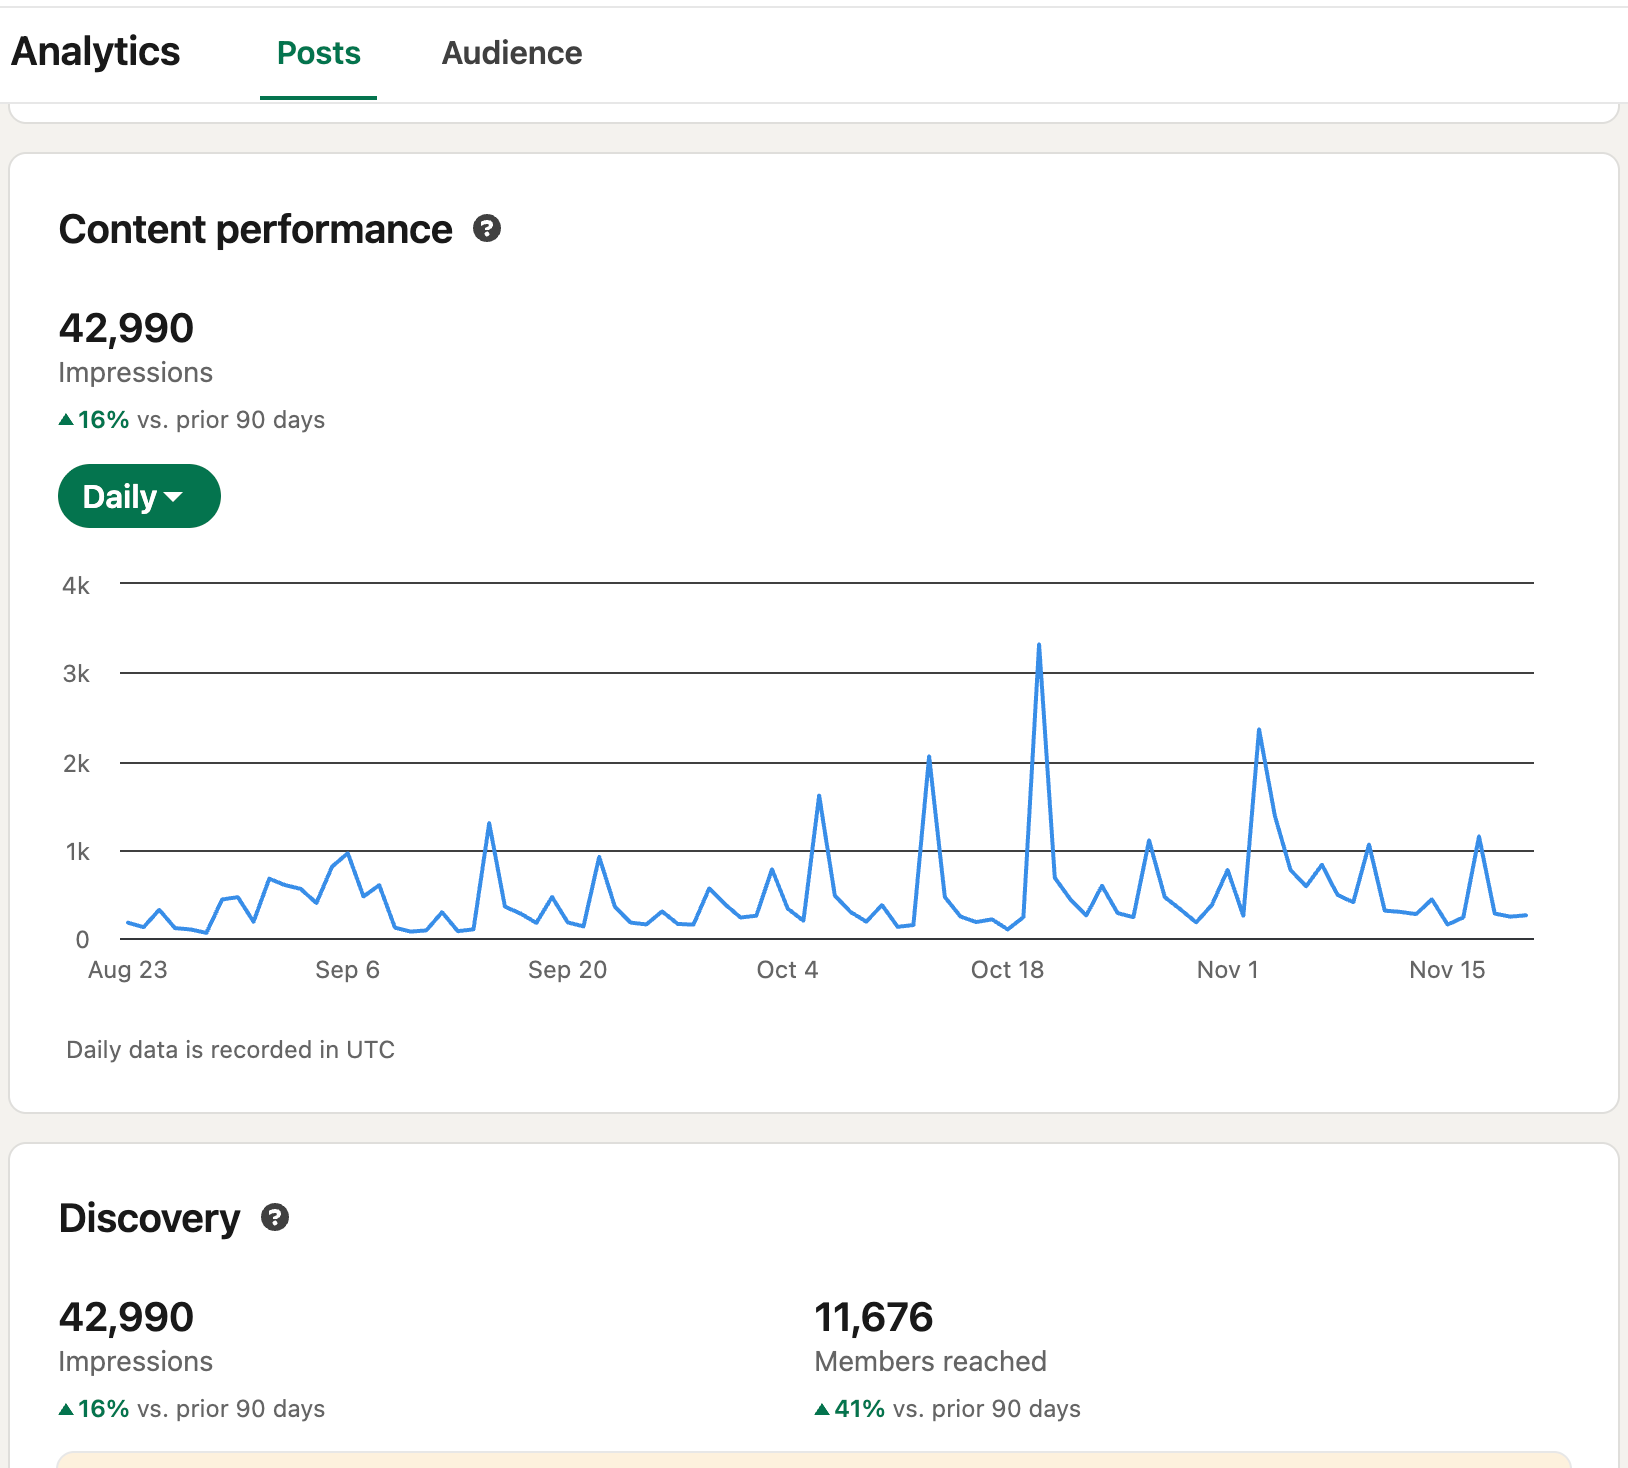
Impressions vs. Members reached: “Impressions” is how many times your post was served. “Members reached” is the number of unique humans who saw it.
Debug: If impressions are high but members reached is low, the same people are seeing your post multiple times (maybe because you have a small, engaged circle, but no virality).
Top performing posts: Look at your top 3. What do they have in common? Was it a specific topic (e.g., AI, a technical rant)? Was it the format (text-only vs. image)?
Action: Reverse-engineer your own success. Do more of what worked in those top 3.
4. Engagement type: decoding user behavior 🖱️
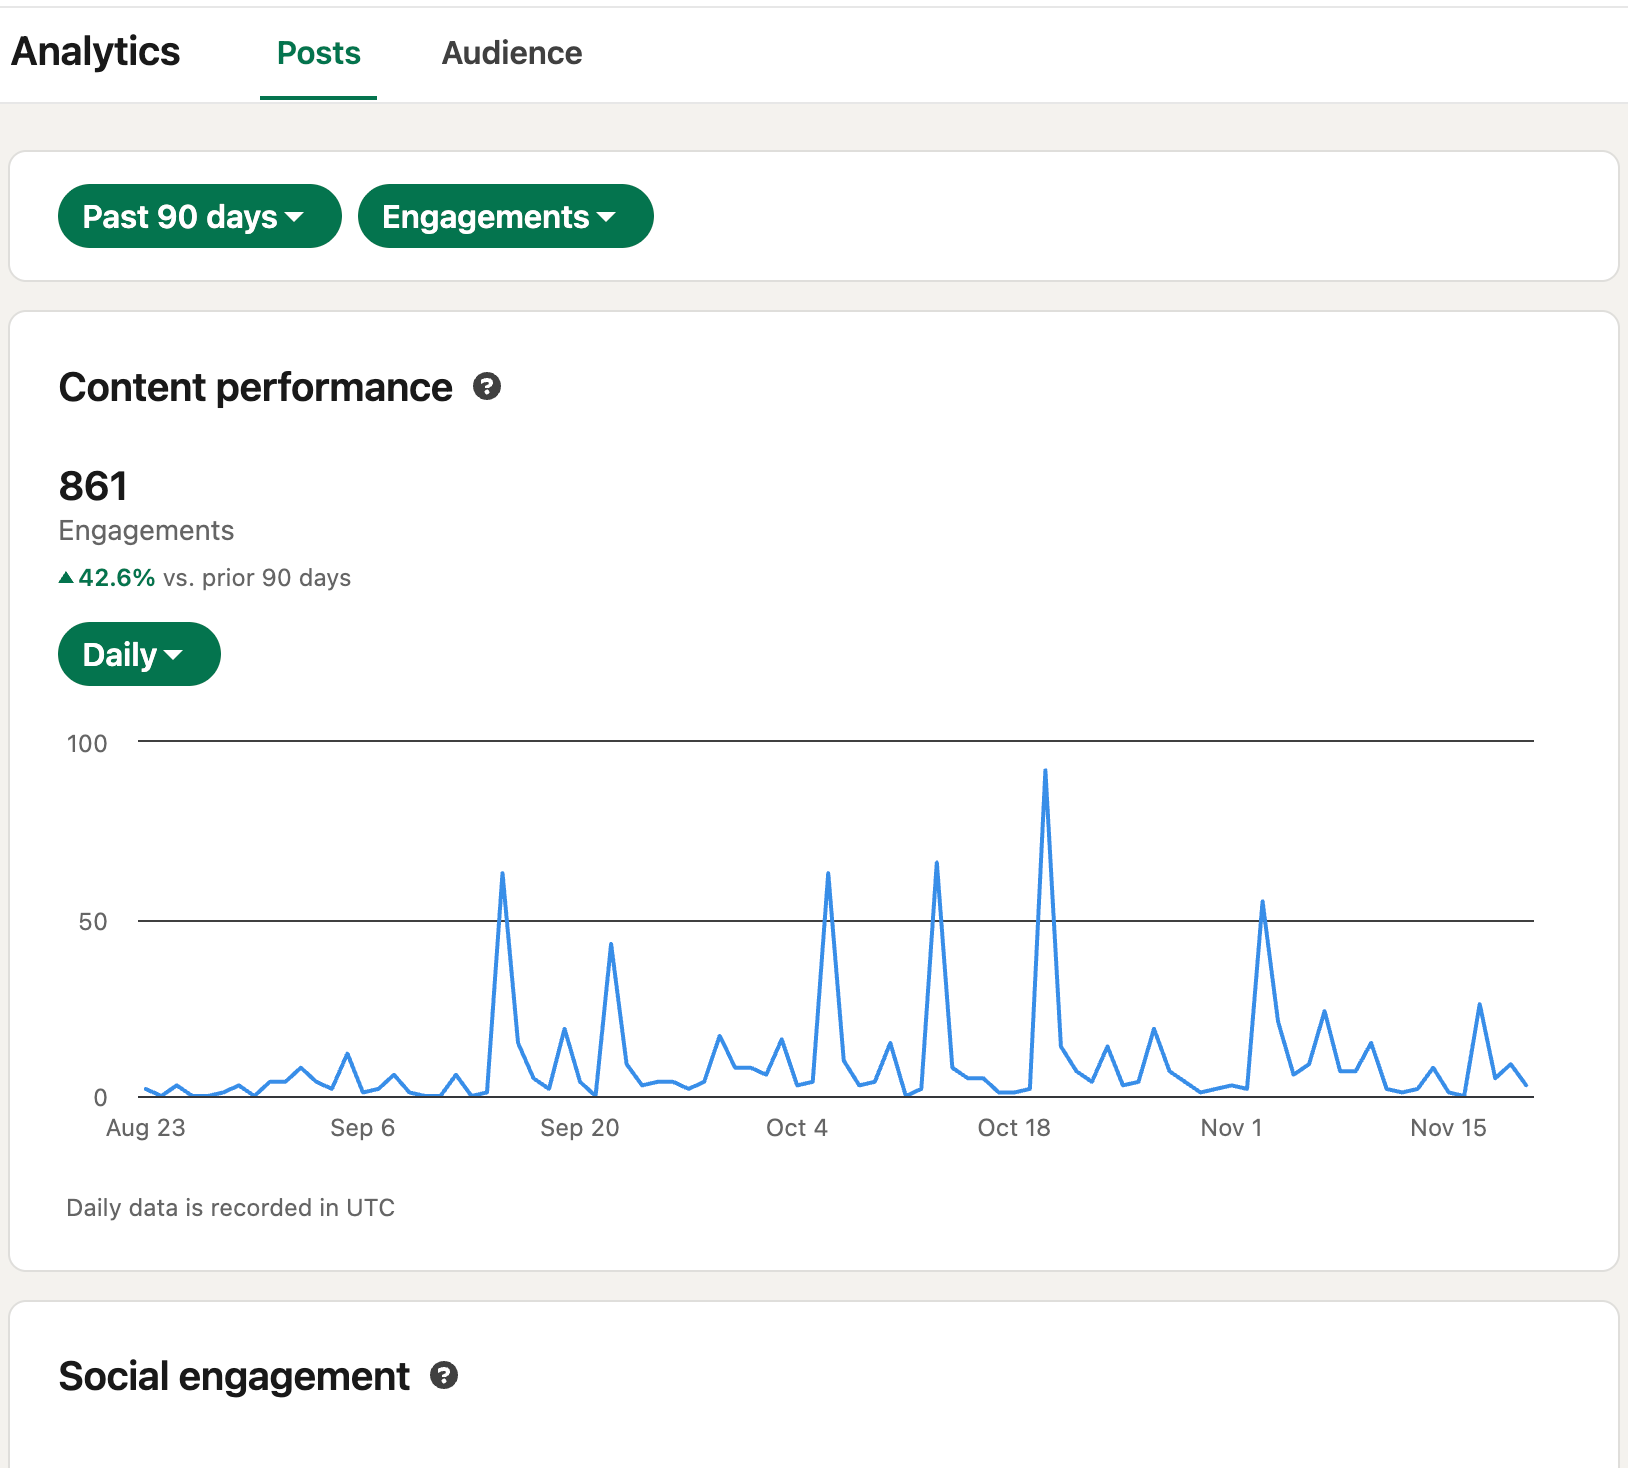
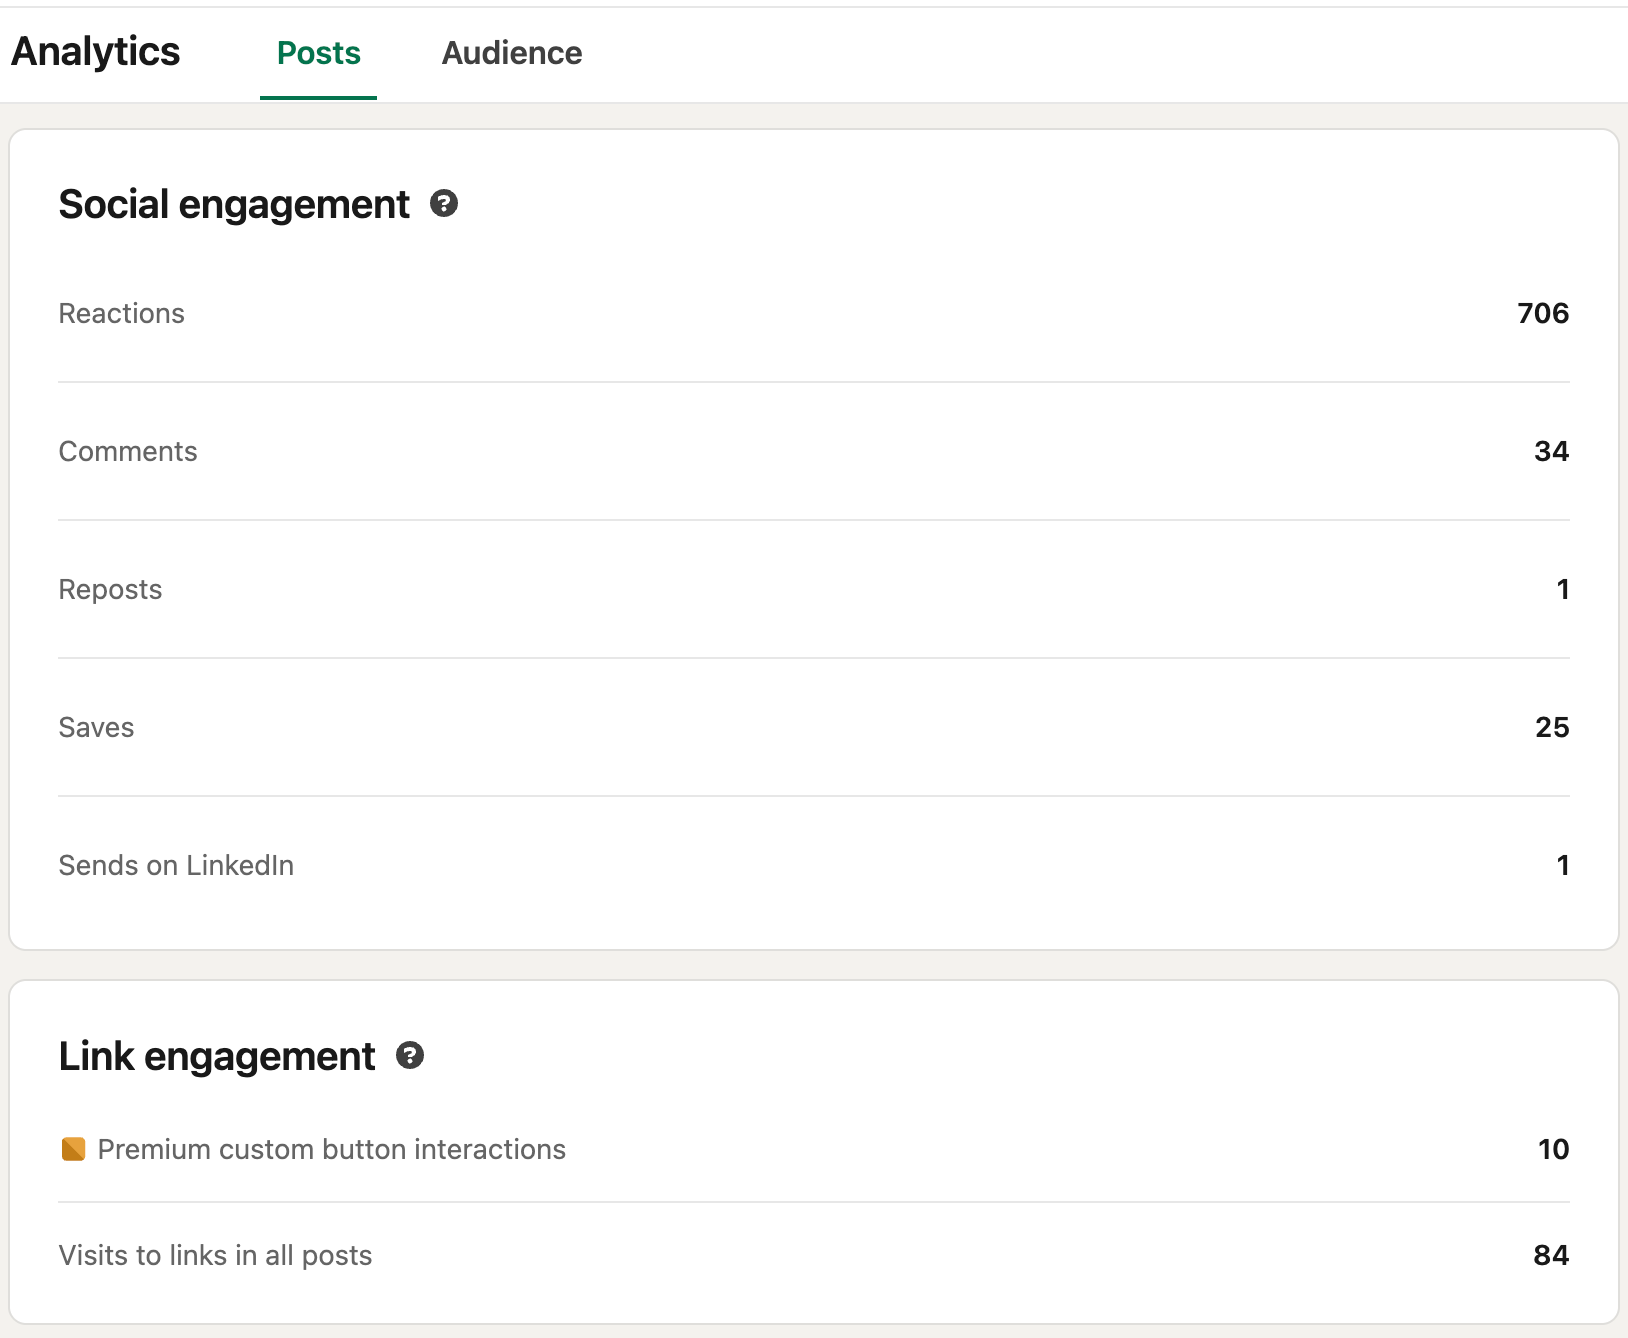
The total “Engagements” number tells you if people reacted. But the breakdown tells you how they reacted.
Reactions: Good for dopamine, low value for career. It’s a “lazy” signal.
Comments: The gold standard. This signals that your content sparked a thought.
Saves: This is the “Technical Value” metric. If people save your post, it means you taught them something useful.
💡 How to boost comments:
Don’t end with a statement, end with a question. But not a generic one. Ask for a specific experience. Instead of “What do you think?”, ask “Have you ever dealt with this specific bug in production?”.
Reply to every comment (fast). The algorithm rewards conversations. If you reply quickly, it shows the post is “alive” and pushes it to more people.
5. Audience demographics: who is actually listening? 🎯
You might have 2,000 followers, but are they the right ones? LinkedIn breaks this down by Job Title, Seniority, and Company Size.
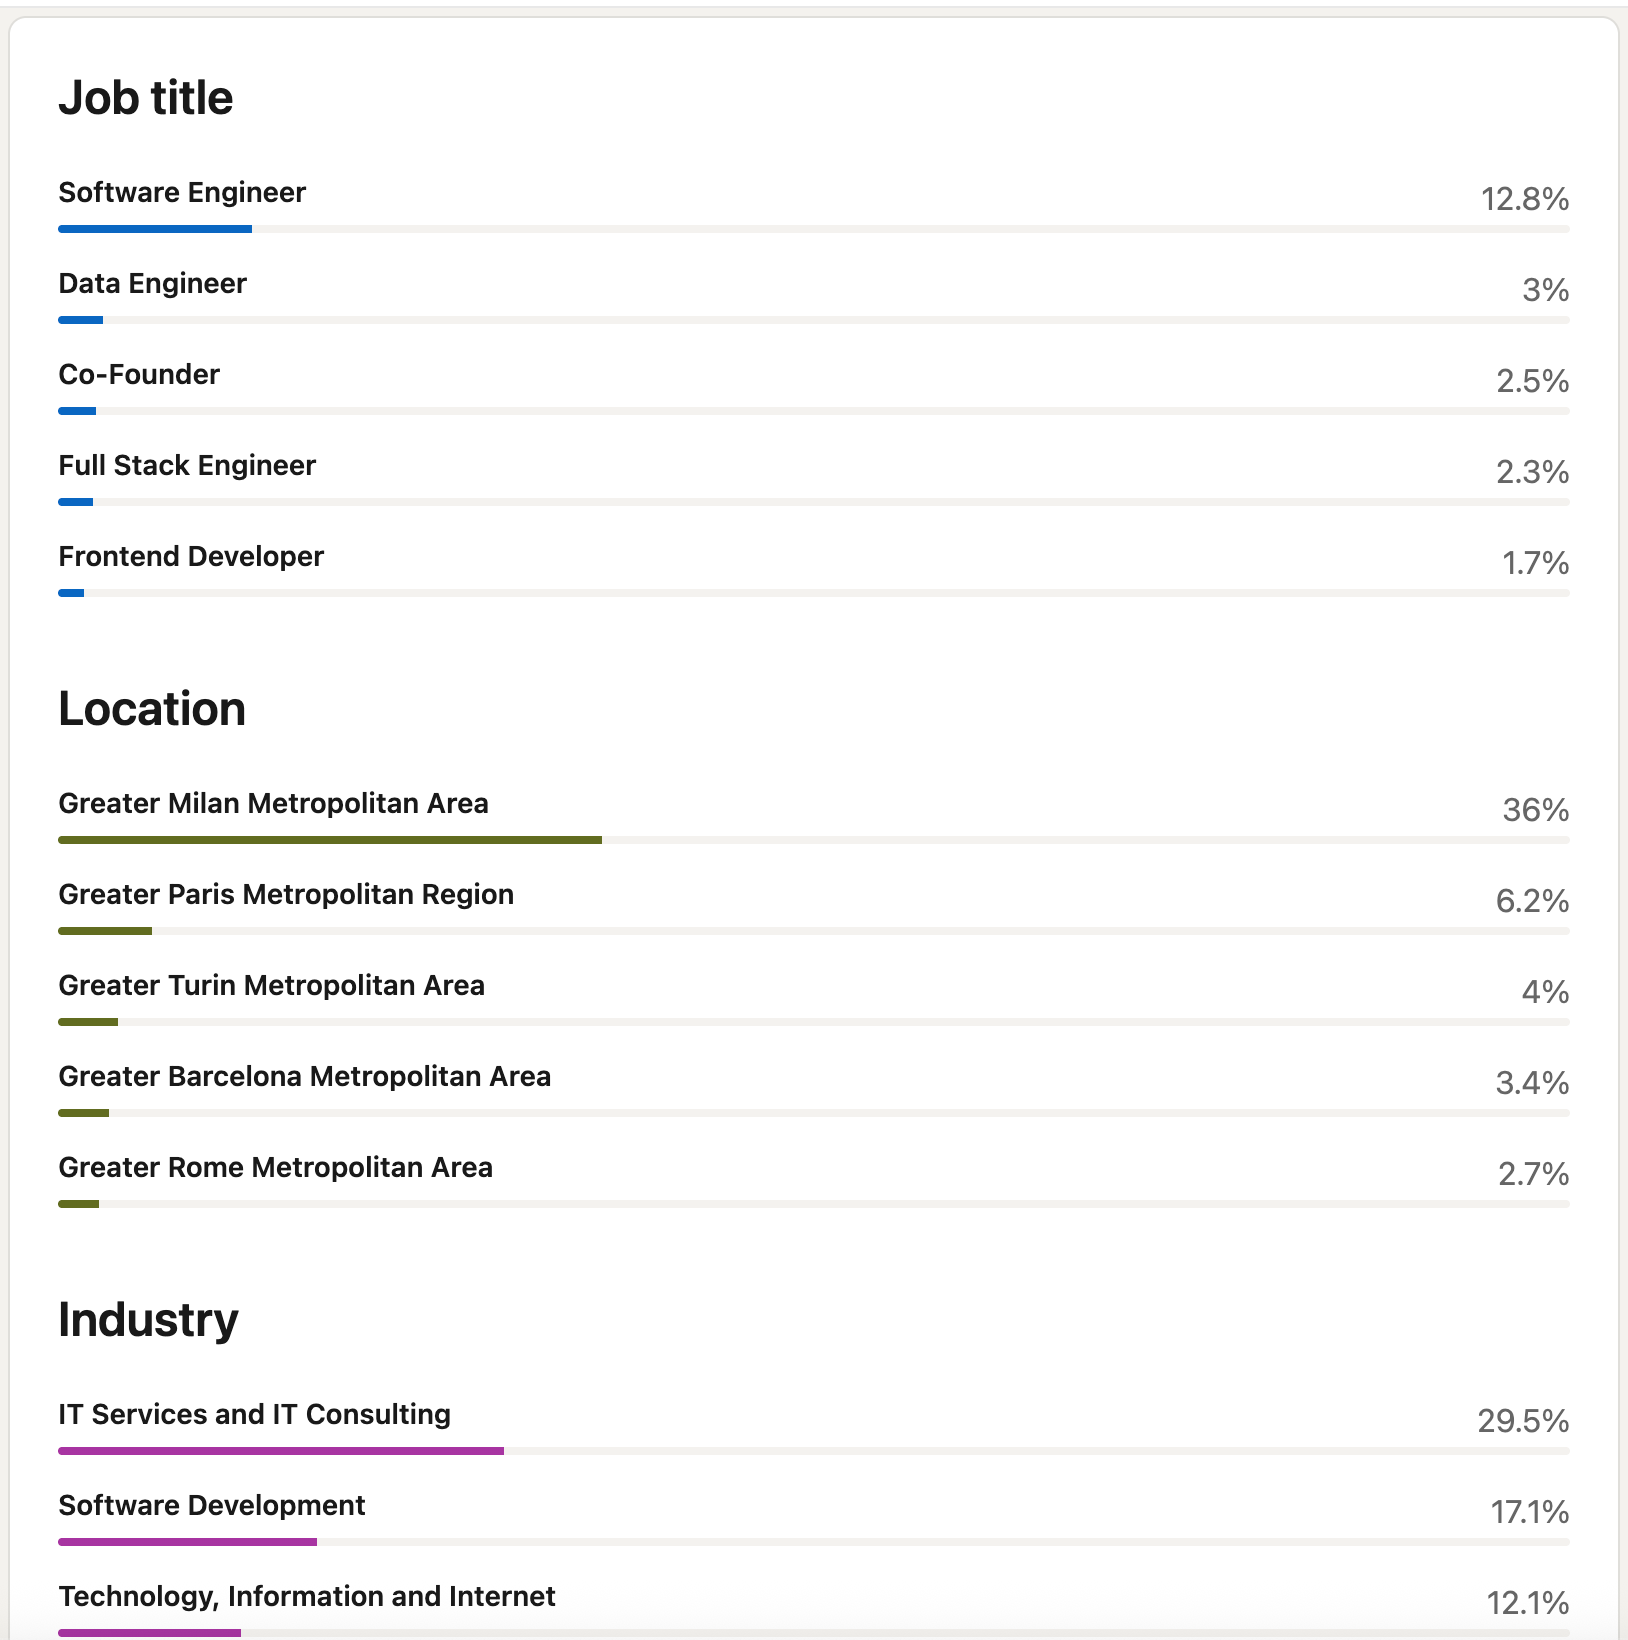
The Seniority Trap: If you want a Senior/Staff role, but 90% of your audience is “Entry Level,” you are mentoring, not networking for a job.
💡 How to fix your audience:
Change your content complexity. To attract seniors, stop posting “Top 5 VS Code extensions” tutorials. Start posting about architectural trade-offs, legacy code refactoring, or system design failures. The juniors might tune out, but the seniors will tune in.
Engage where they are. Go to the profiles of 5 Senior Engineers you admire and turn on the bell notification. When they post, leave a high-value comment. Their network will see you.
6. Search appearances: fixing your SEO 🔎

This is the number one metric for getting hired passively. If this is low, you are invisible to recruiters.
💡 How to boost search hits:
Kill the “creative” titles. Recruiters search for “Java Developer,” not “Code Ninja” or “Tech Enthusiast.” Use standard industry titles in your Headline.
The “Skills” section matters. LinkedIn’s algorithm heavily weights the 50 skills you list in the “Skills” section. Fill them all up with relevant keywords (technologies, frameworks, methodologies).
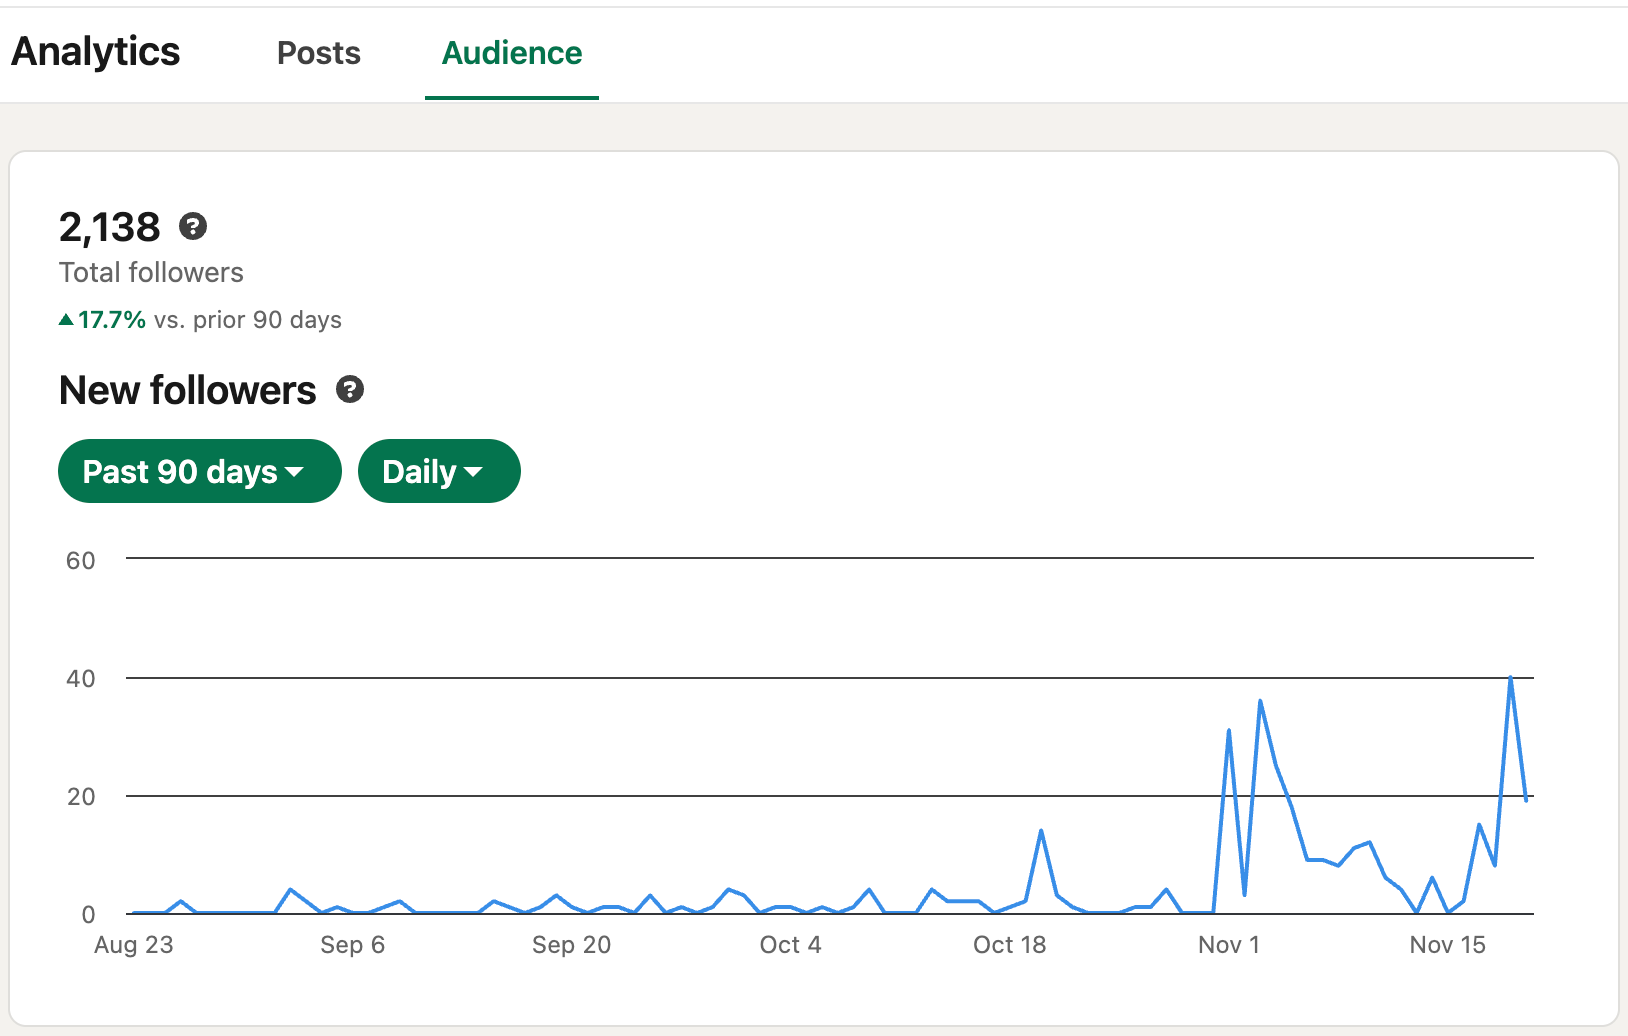
7. Follower growth: your north star ⭐
Finally, look at your follower graph. Is it trending up? A healthy profile should be growing consistently over time. But you shouldn’t just wait for people to follow you. You need to be proactive.
💡 How to execute the “connection grind”: Don’t just add random people. Be a sniper. Target people who are qualitatively interesting and do similar work to you.
Here are the best moments to send a connection request:
When a 2nd-degree connection likes or comments on your post: They already know who you are. The acceptance rate here is huge.
When someone views your profile: Don’t let them walk away. Connect and say thanks for stopping by.
When someone interacts with a colleague: If you see a comment on a friend’s post, connect with that person.
Pro Tip: The “Pre-Post Boost” 🚀 Going on a connection spree is also a tactical move. When you view someone’s profile to connect, they often view yours back (boosting your stats). Even better: when a new connection accepts, the algorithm often shows them your next post immediately to “introduce” you. If you connect with 10 relevant people right before you publish a new post, you give that post an instant boost of high-quality impressions.
The iteration loop: Don’t just look at these numbers once a year. Make it a monthly routine (I suggest to go daily 👀).
If Impressions are low → Fix your hooks and formatting. If Demographics are wrong → Increase the technical depth of your topics. If Growth is flat → Start executing the “connection grind” daily.
Treat your career like a product. Measure the data, ship an improvement, and check the logs again.